Your pipeline writes the clinical case. Squiggler is the step that draws its ECGs and measures them, so the rest of the case can be checked against the tracings.
Where Squiggler fits
One step in the pipeline. It takes a description of the heart at each stage and returns the tracings with their measurements. The next step uses those to check the case.
Learning objectives, setting, length.
Inferior STEMI with AV block. ED team, 20 minutes.Your model writes the patient, stages, vitals, labs, expected actions and debrief.
Squiggler draws the heart at each stage and measures what it drew.
Returns the images, the waveform and the measurements.- Describe. One JSON description per stage, same patient.
- Check. Rhythm, rates, intervals and ST changes, lead by lead.
- Draw. Twelve-lead images and a monitor waveform.
Vitals, findings and debrief are checked against the measured ECGs.
↻ Mismatch: regenerate that stage.Case file, ECG images and waveform.
Faculty review, then into the simulator.
Example output
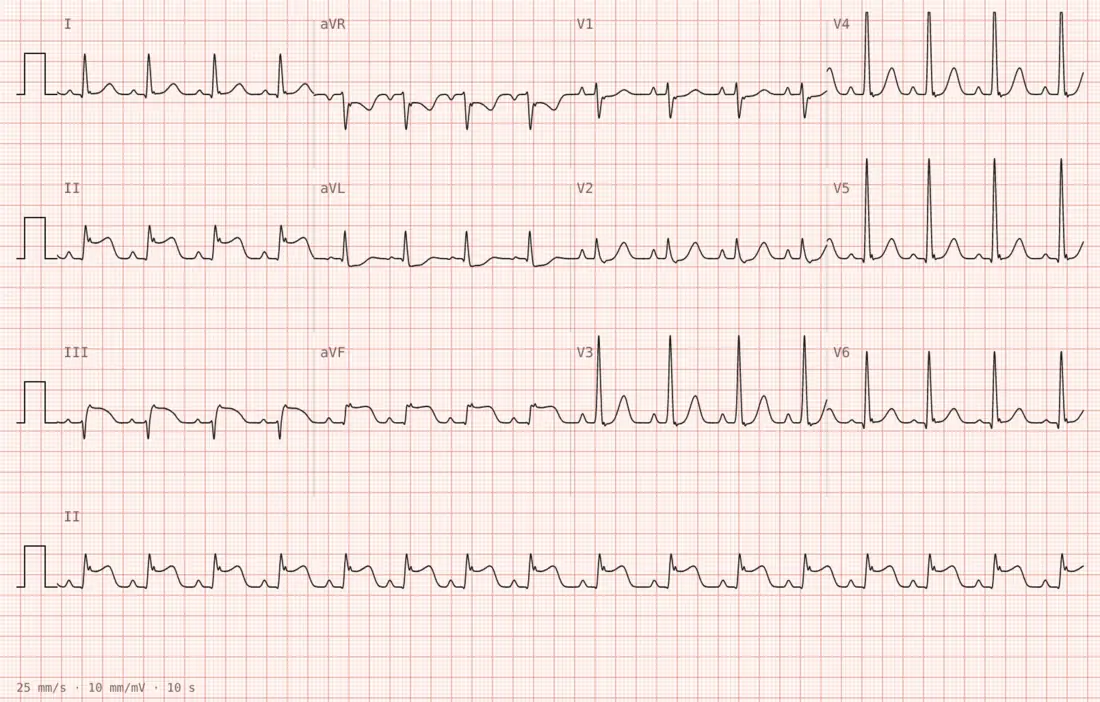
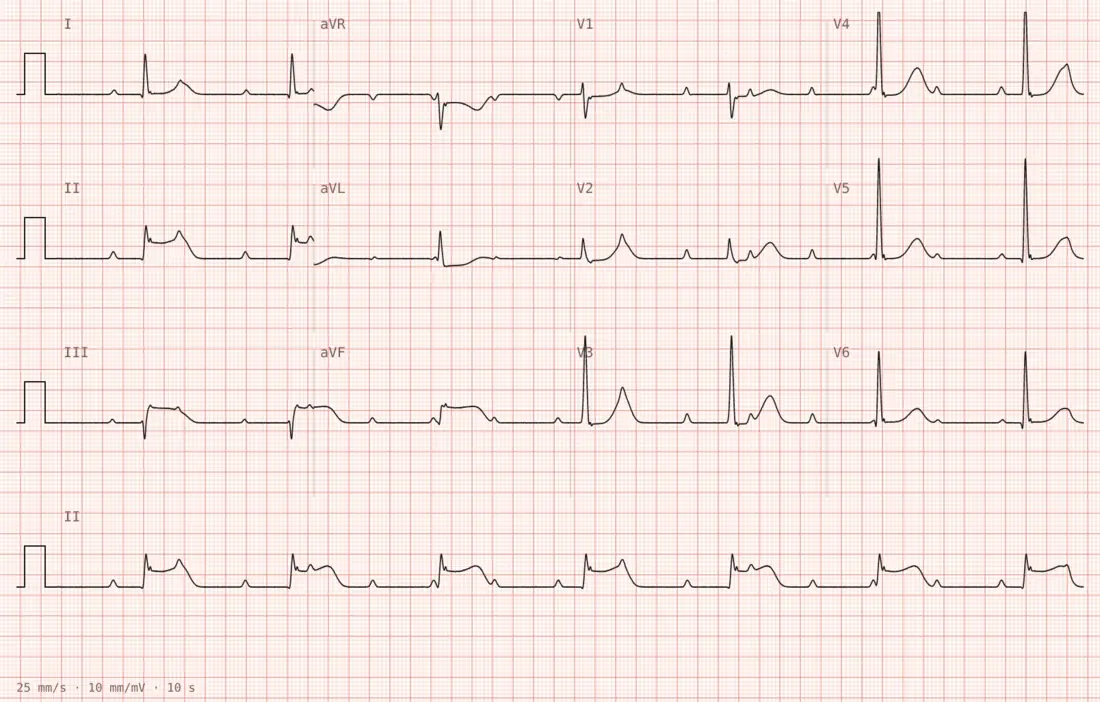
Two stages, one patient
Stage 1, arrival. 68-year-old, chest pain for 40 minutes. HR 96, BP 104/62. Aspirin, cath lab called.
Stage 2, 15 minutes later. Dizzy. HR 42, BP 78/40. Atropine, pacing pads.
Both heart rates were validated against the tracings.
Integration notes
- Built for model-driven pipelines. A Claude skill and an OpenAPI spec are provided.
- Deterministic. The same description always gives the same tracing, so cases can be regenerated and cached.
- Image or signal. PNG or SVG for printouts, millivolts per lead for a monitor.
- Server-side key. Your pipeline holds it; nothing runs in the learner’s browser.
- Your branding. A credit line or logo can be printed on the paper.
Getting started
-
Request a key
-
Read the reference
-
Connect your pipeline